How to Build a Self-Service Platform on Upbound: Day 2

The previous posts in this ongoing series covered Day 0 (getting up and running with your first control plane in minutes) and Day 1 (configuring your control planes for GitOps). Today, we’ll focus on one of the core Day 2 operations for a platform team: debugging resource health.
Upbound simplifies a number of Day 2 operations for platform teams. With managed control planes (MCPs), patch management and updates of the underlying infrastructure, scaling of your control planes, and snapshotting for backups and recovery are all handled on your behalf by Upbound. As a platform engineer, this means your team can focus on defining the custom APIs that end users will interact with in order to request infrastructure, as well as debugging API calls flowing through your control planes. Let’s get into how the debugging experience differs between Crossplane and Upbound.
Debugging with Crossplane: follow the resource chain
In a recent Crossplane blog post, Jared Watts laid out the steps involved in trying to determine why a Crossplane composition is not working as intended. Core to this workflow is using kubectl to follow the chain of references from claims (XRCs) to composite resources (XRs) to managed resources (MRs). As you move down the chain, you’ll look for status conditions and events to shed light on the underlying issue. Depending on the complexity of your composition and the number of child composed resources, this can be a fairly involved process.
Debugging with Upbound: traverse the graph
Although you can choose to rely on kubectl for debugging resources in a managed control plane, Upbound offers a built-in experience within the Console. The control plane explorer includes a graphical view of the relationships between claims, composites, and managed resources, meaning you can assess the root cause of an unhealthy claim without switching contexts to the command line. Let’s walk through how you can debug resources in Upbound with a simple example.
Access the control plane explorer
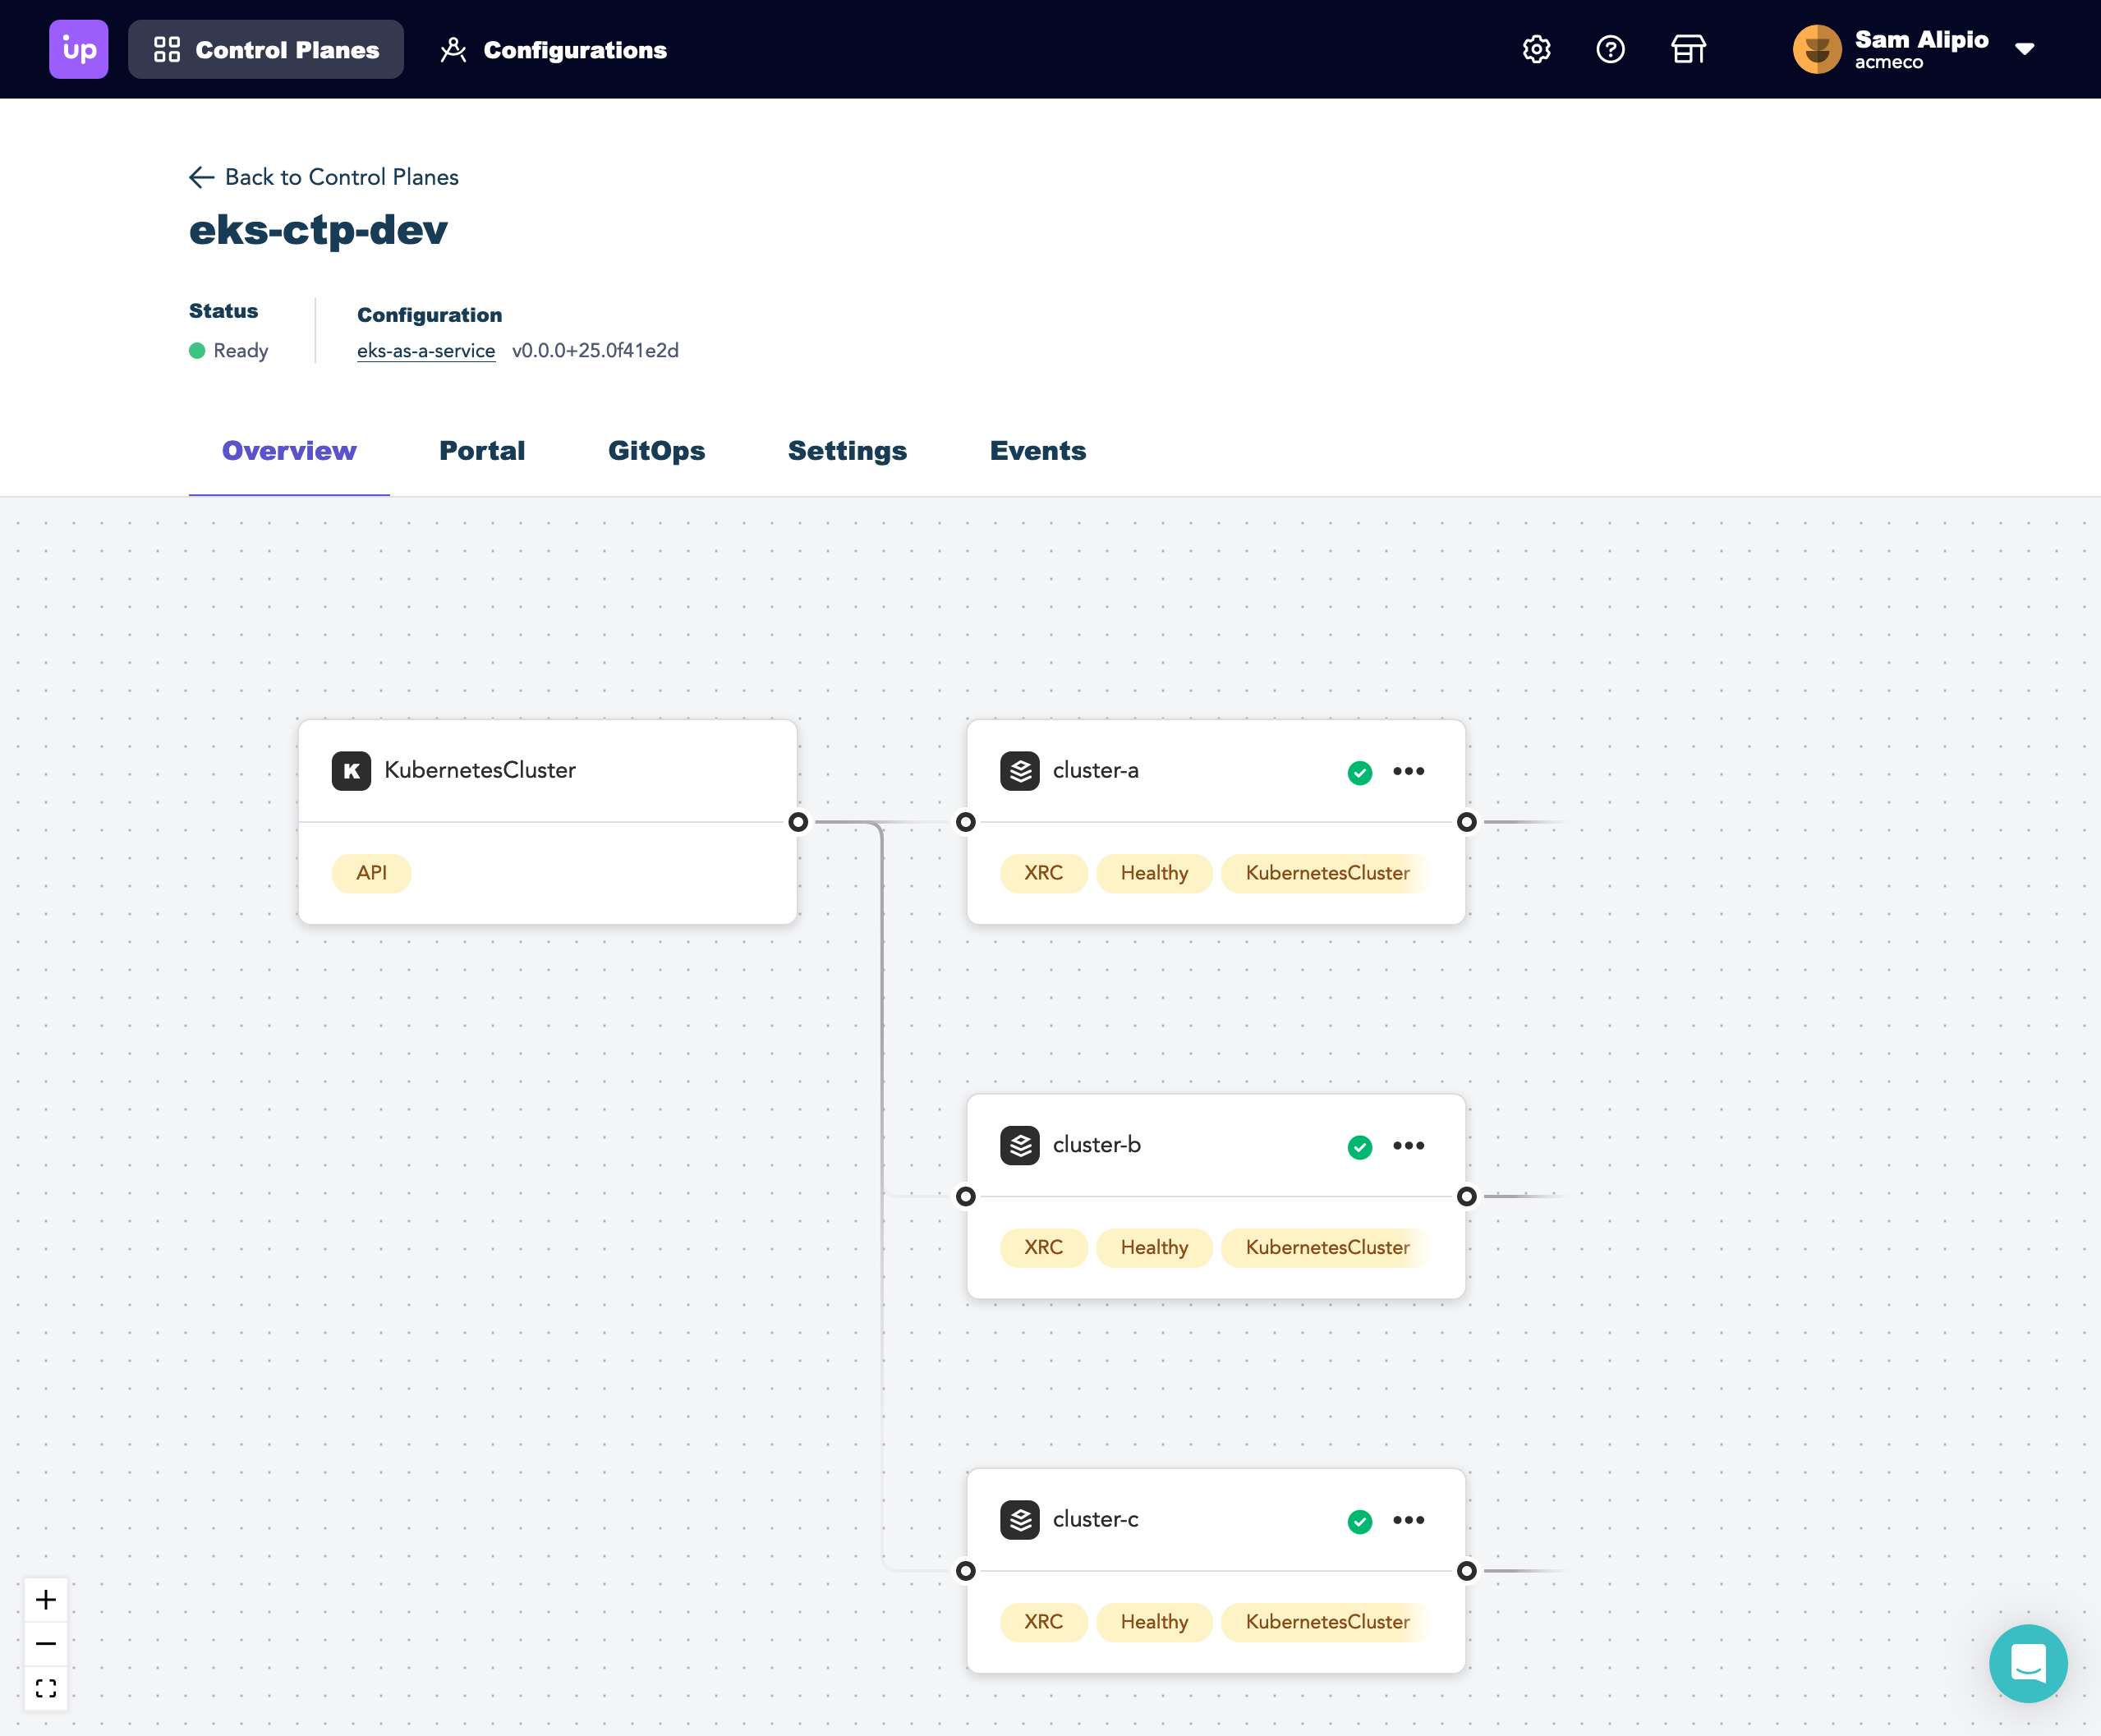
First, we’ll access the details of a particular control plane by selecting it from the dashboard. This will bring us to the control plane explorer scoped to that MCP.
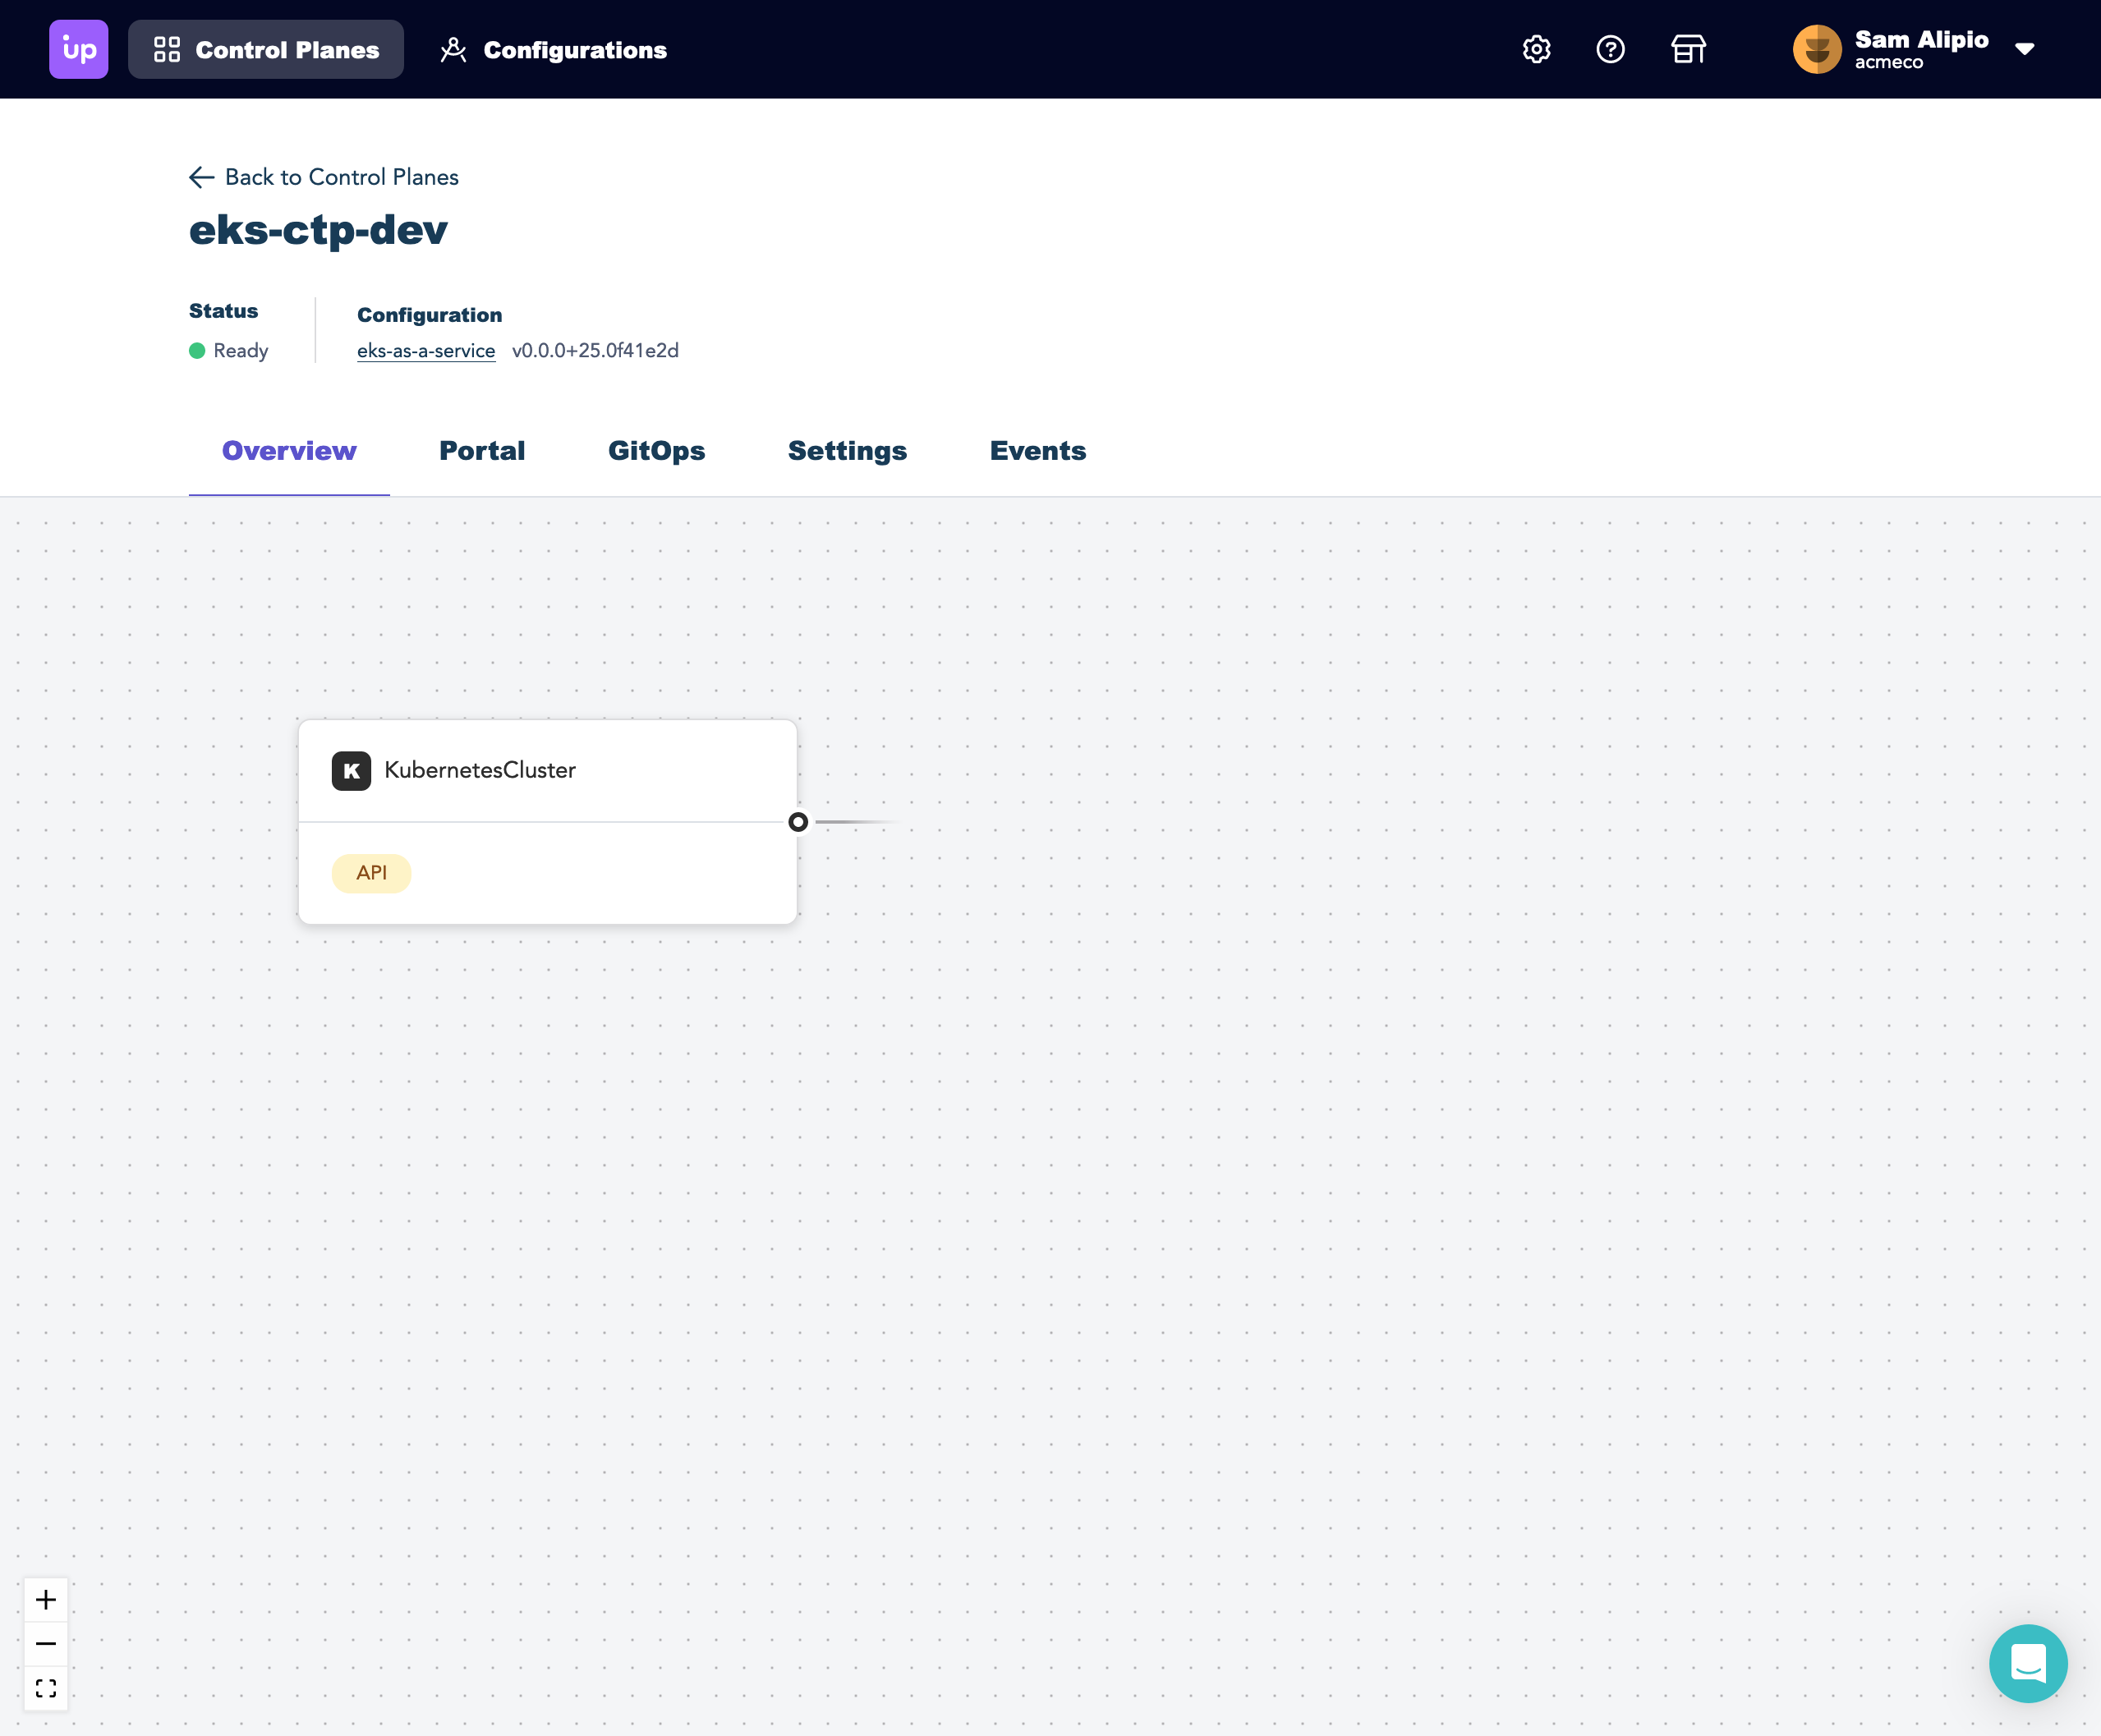
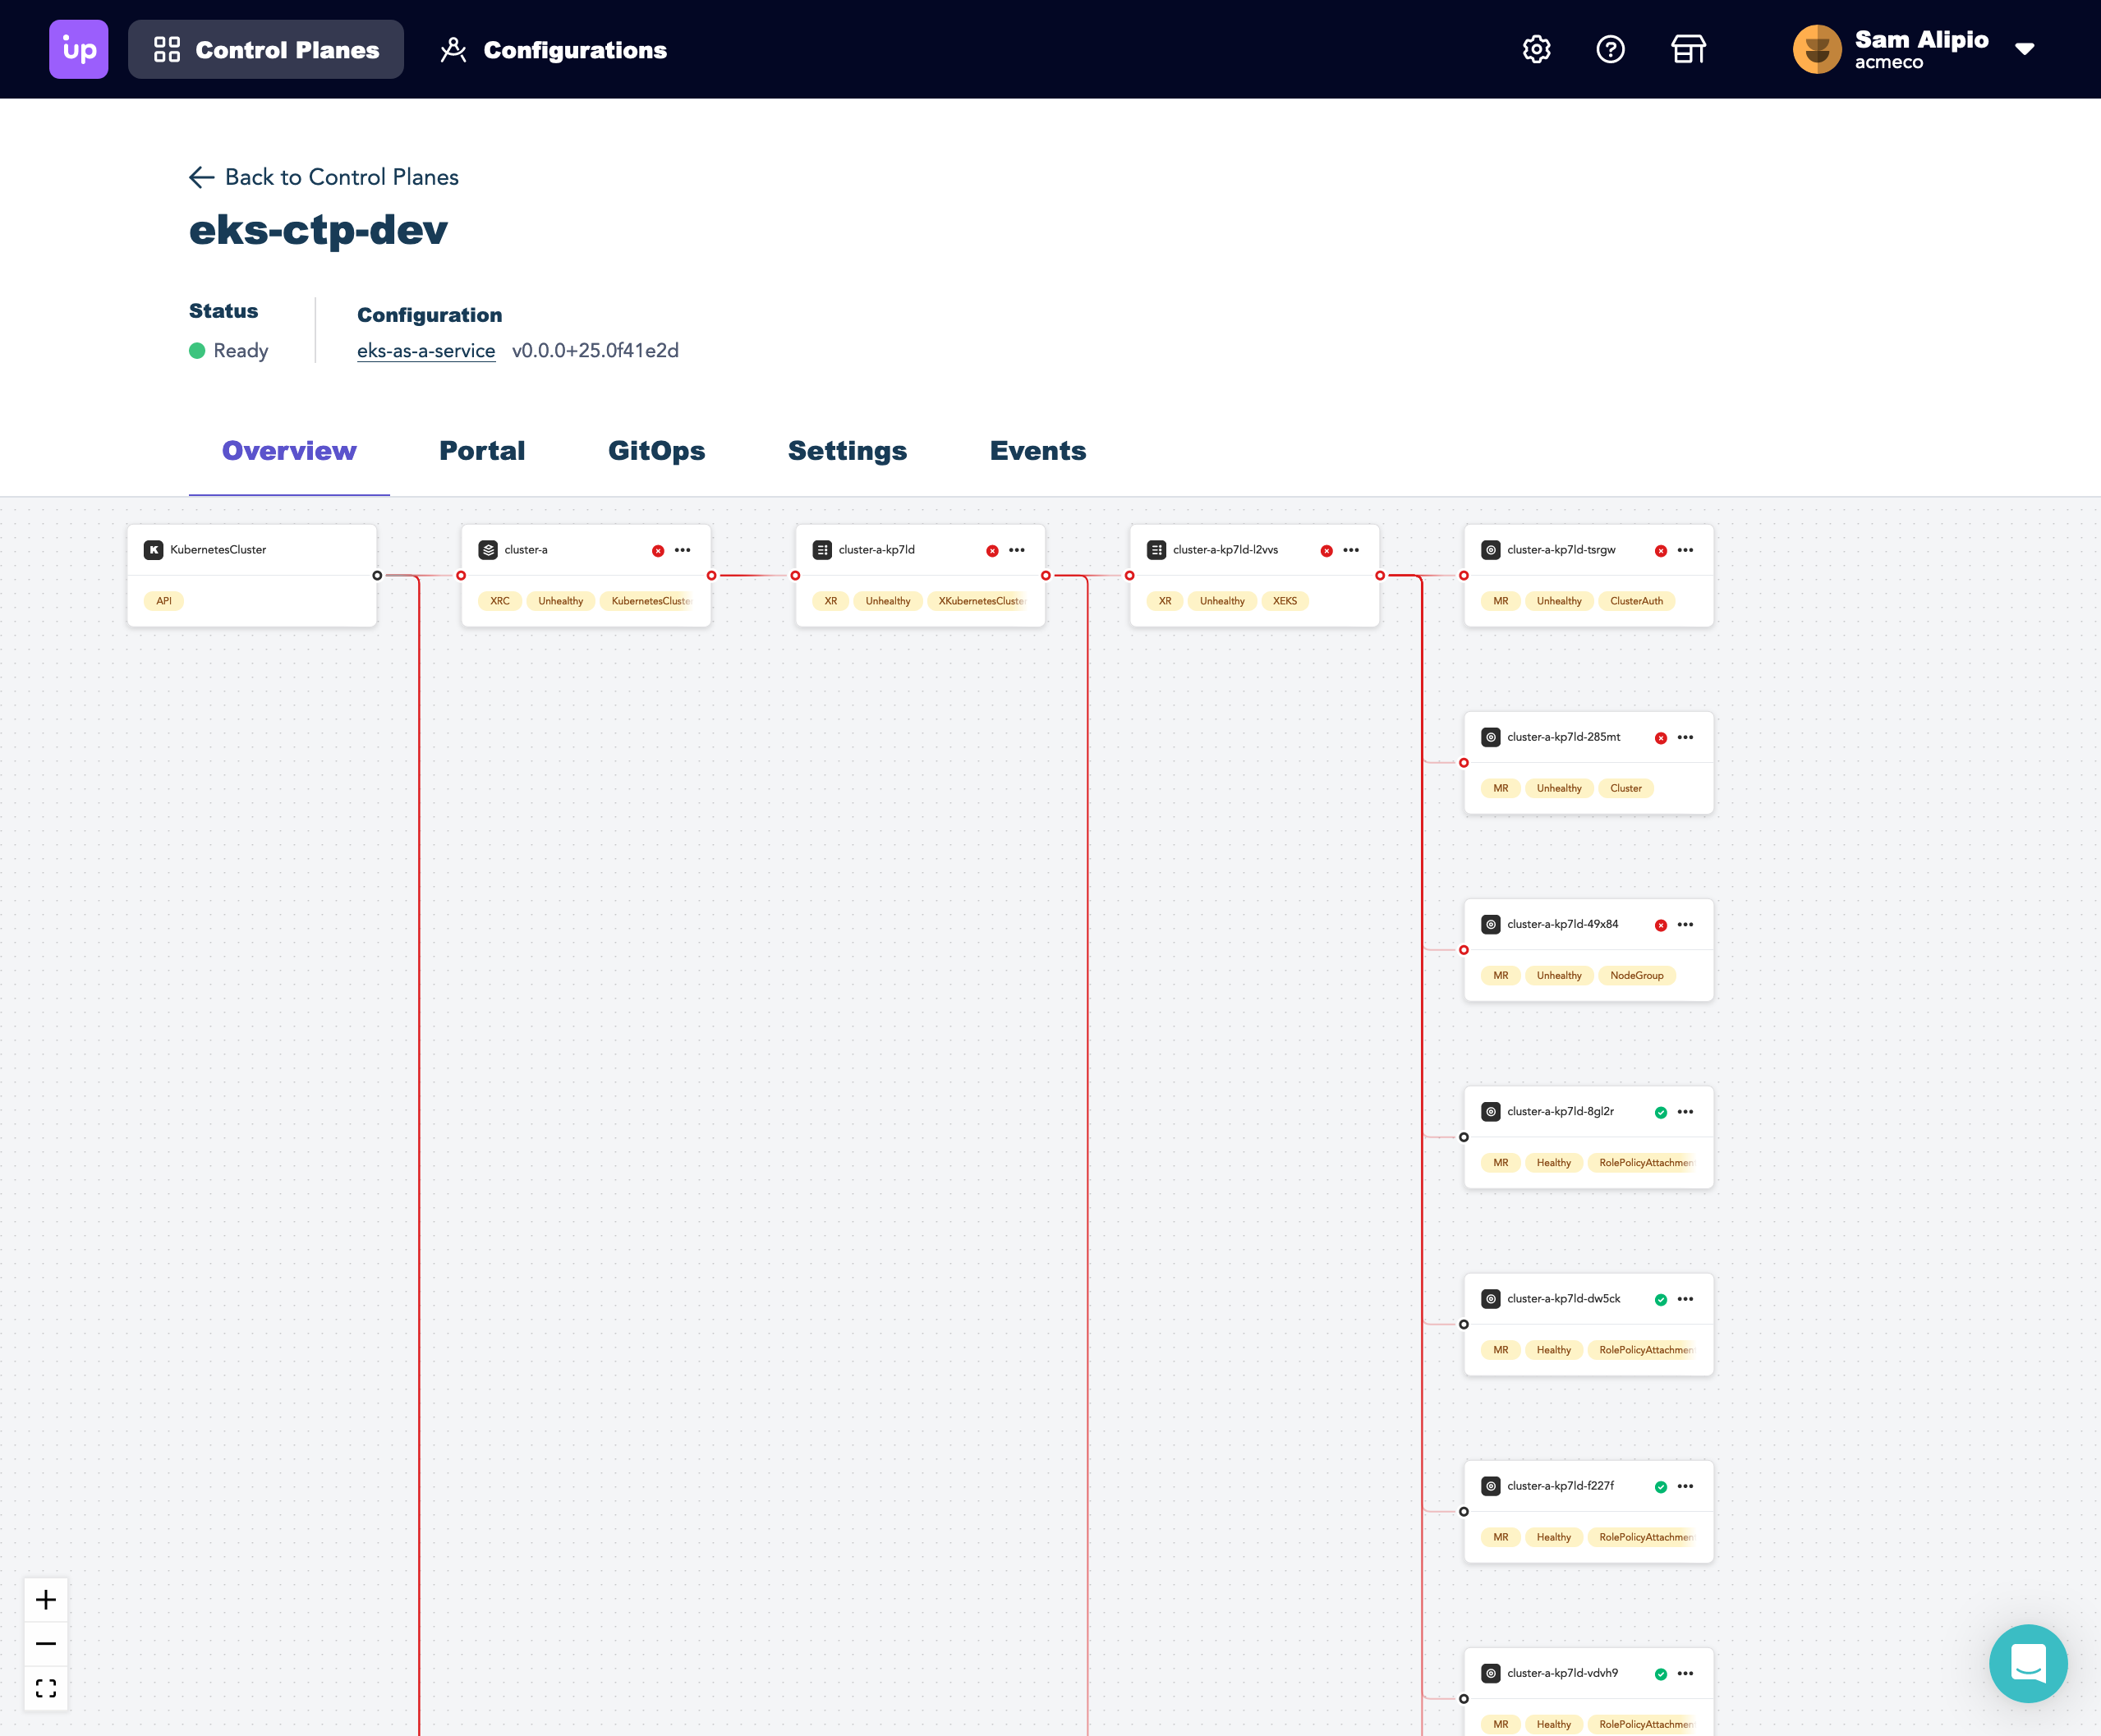
When you first land in the control plane explorer, you’re presented with a collapsed graph view of claims arranged by API type. I’ve installed a configuration into my managed control plane that will allow me to offer EKS as a Service to my team. My configuration bundles up definitions (XRDs) and implementations (compositions) for the APIs needed to provision fully configured EKS clusters with secure networking.
Explore the graph
Selecting a card on the graph will allow you to expand it to see claims against this API. In my example there are three claims, all of which are currently unhealthy.
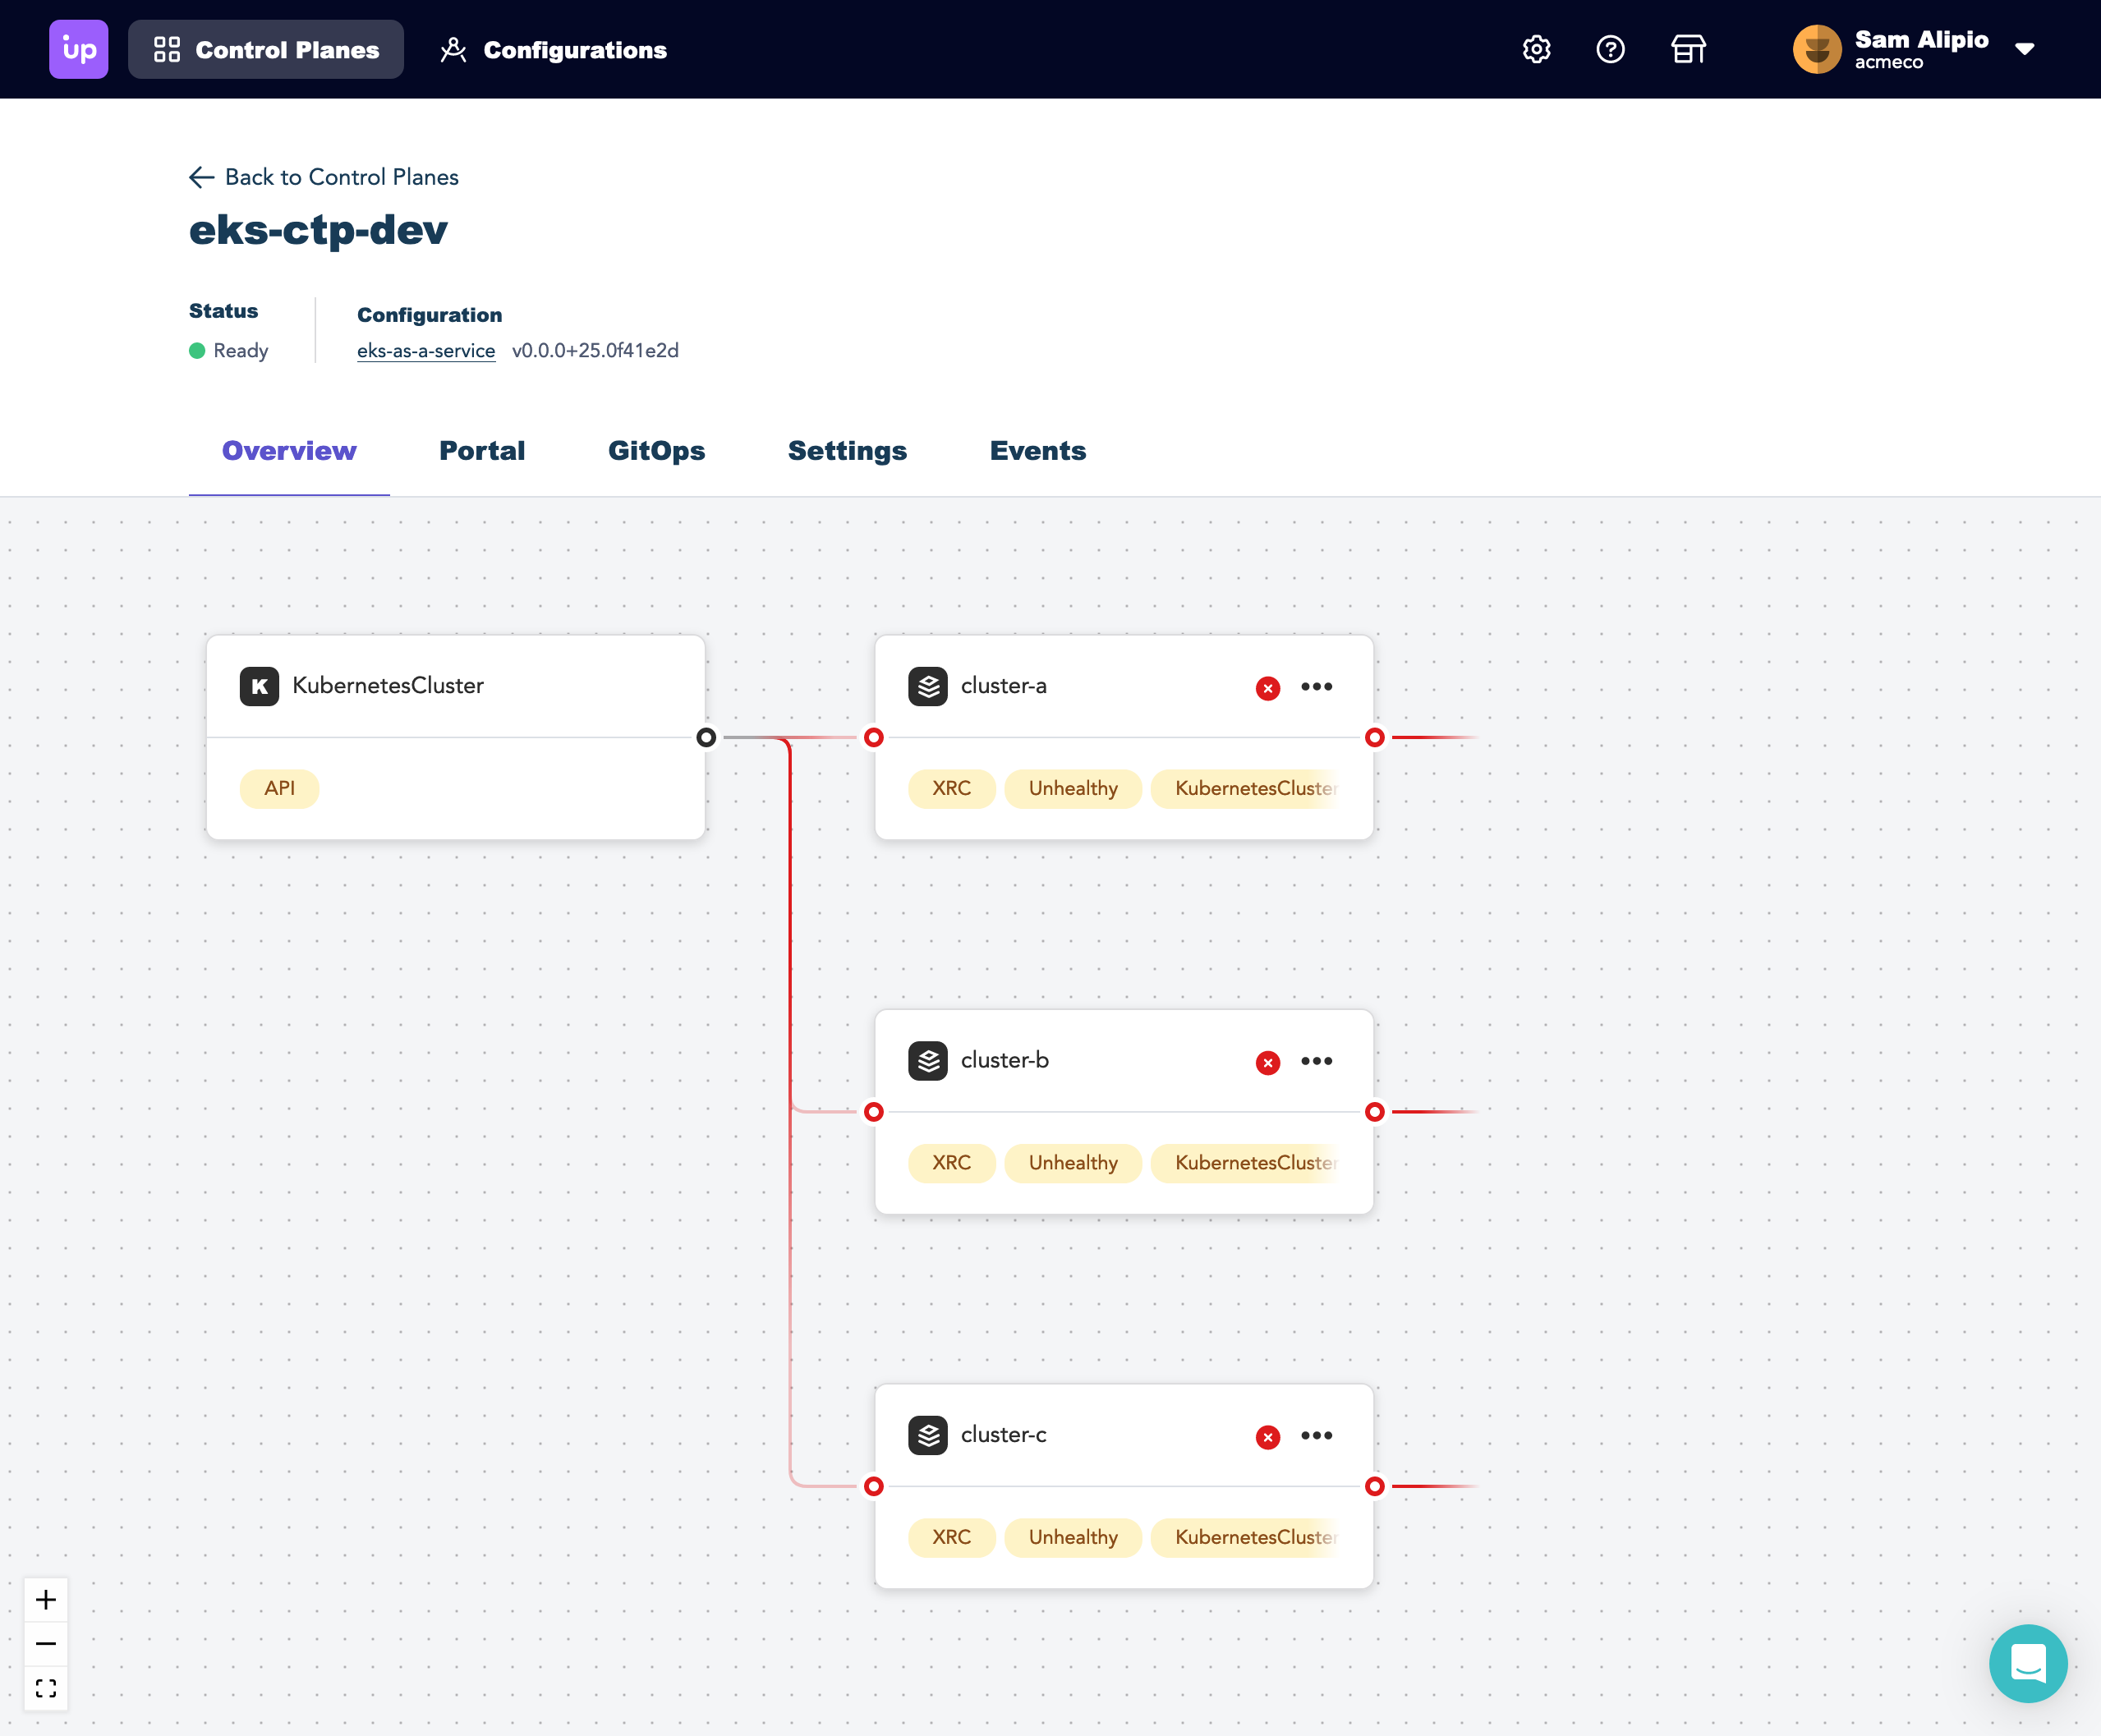
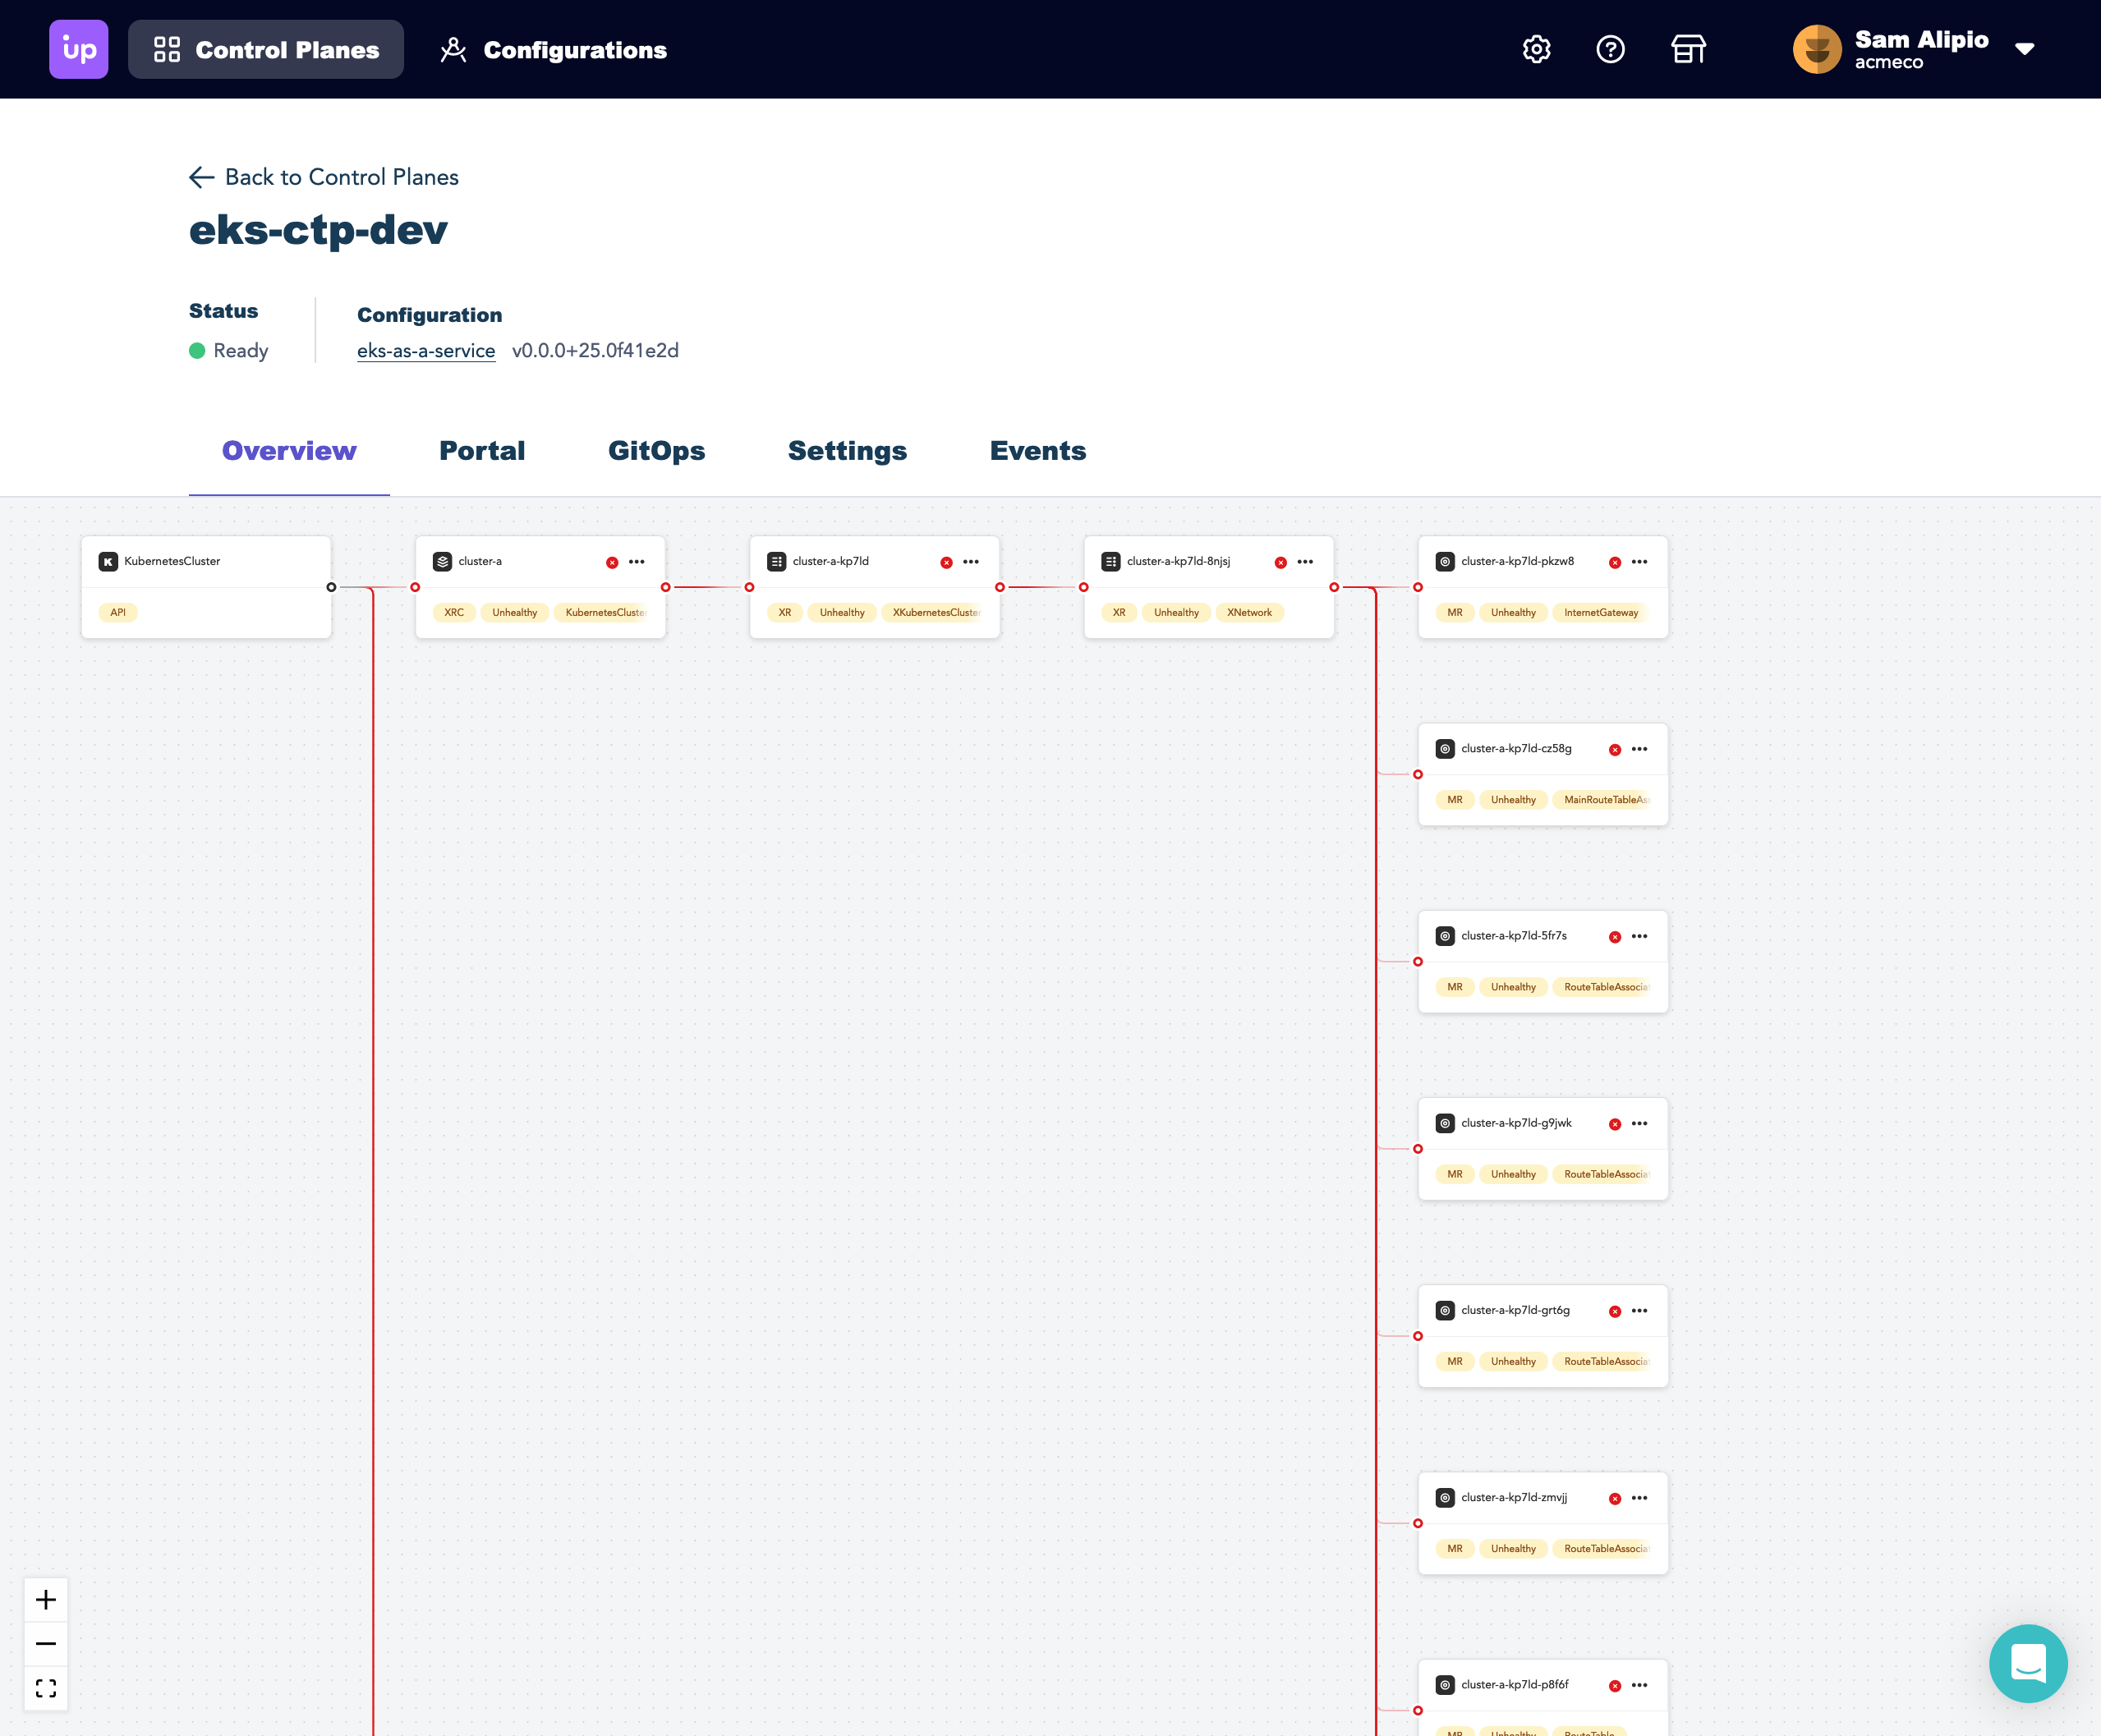
You can expand a claim to get a better picture of the situation. Here you can see the XRs and MRs all appear to be unhealthy as well.
Access resource details
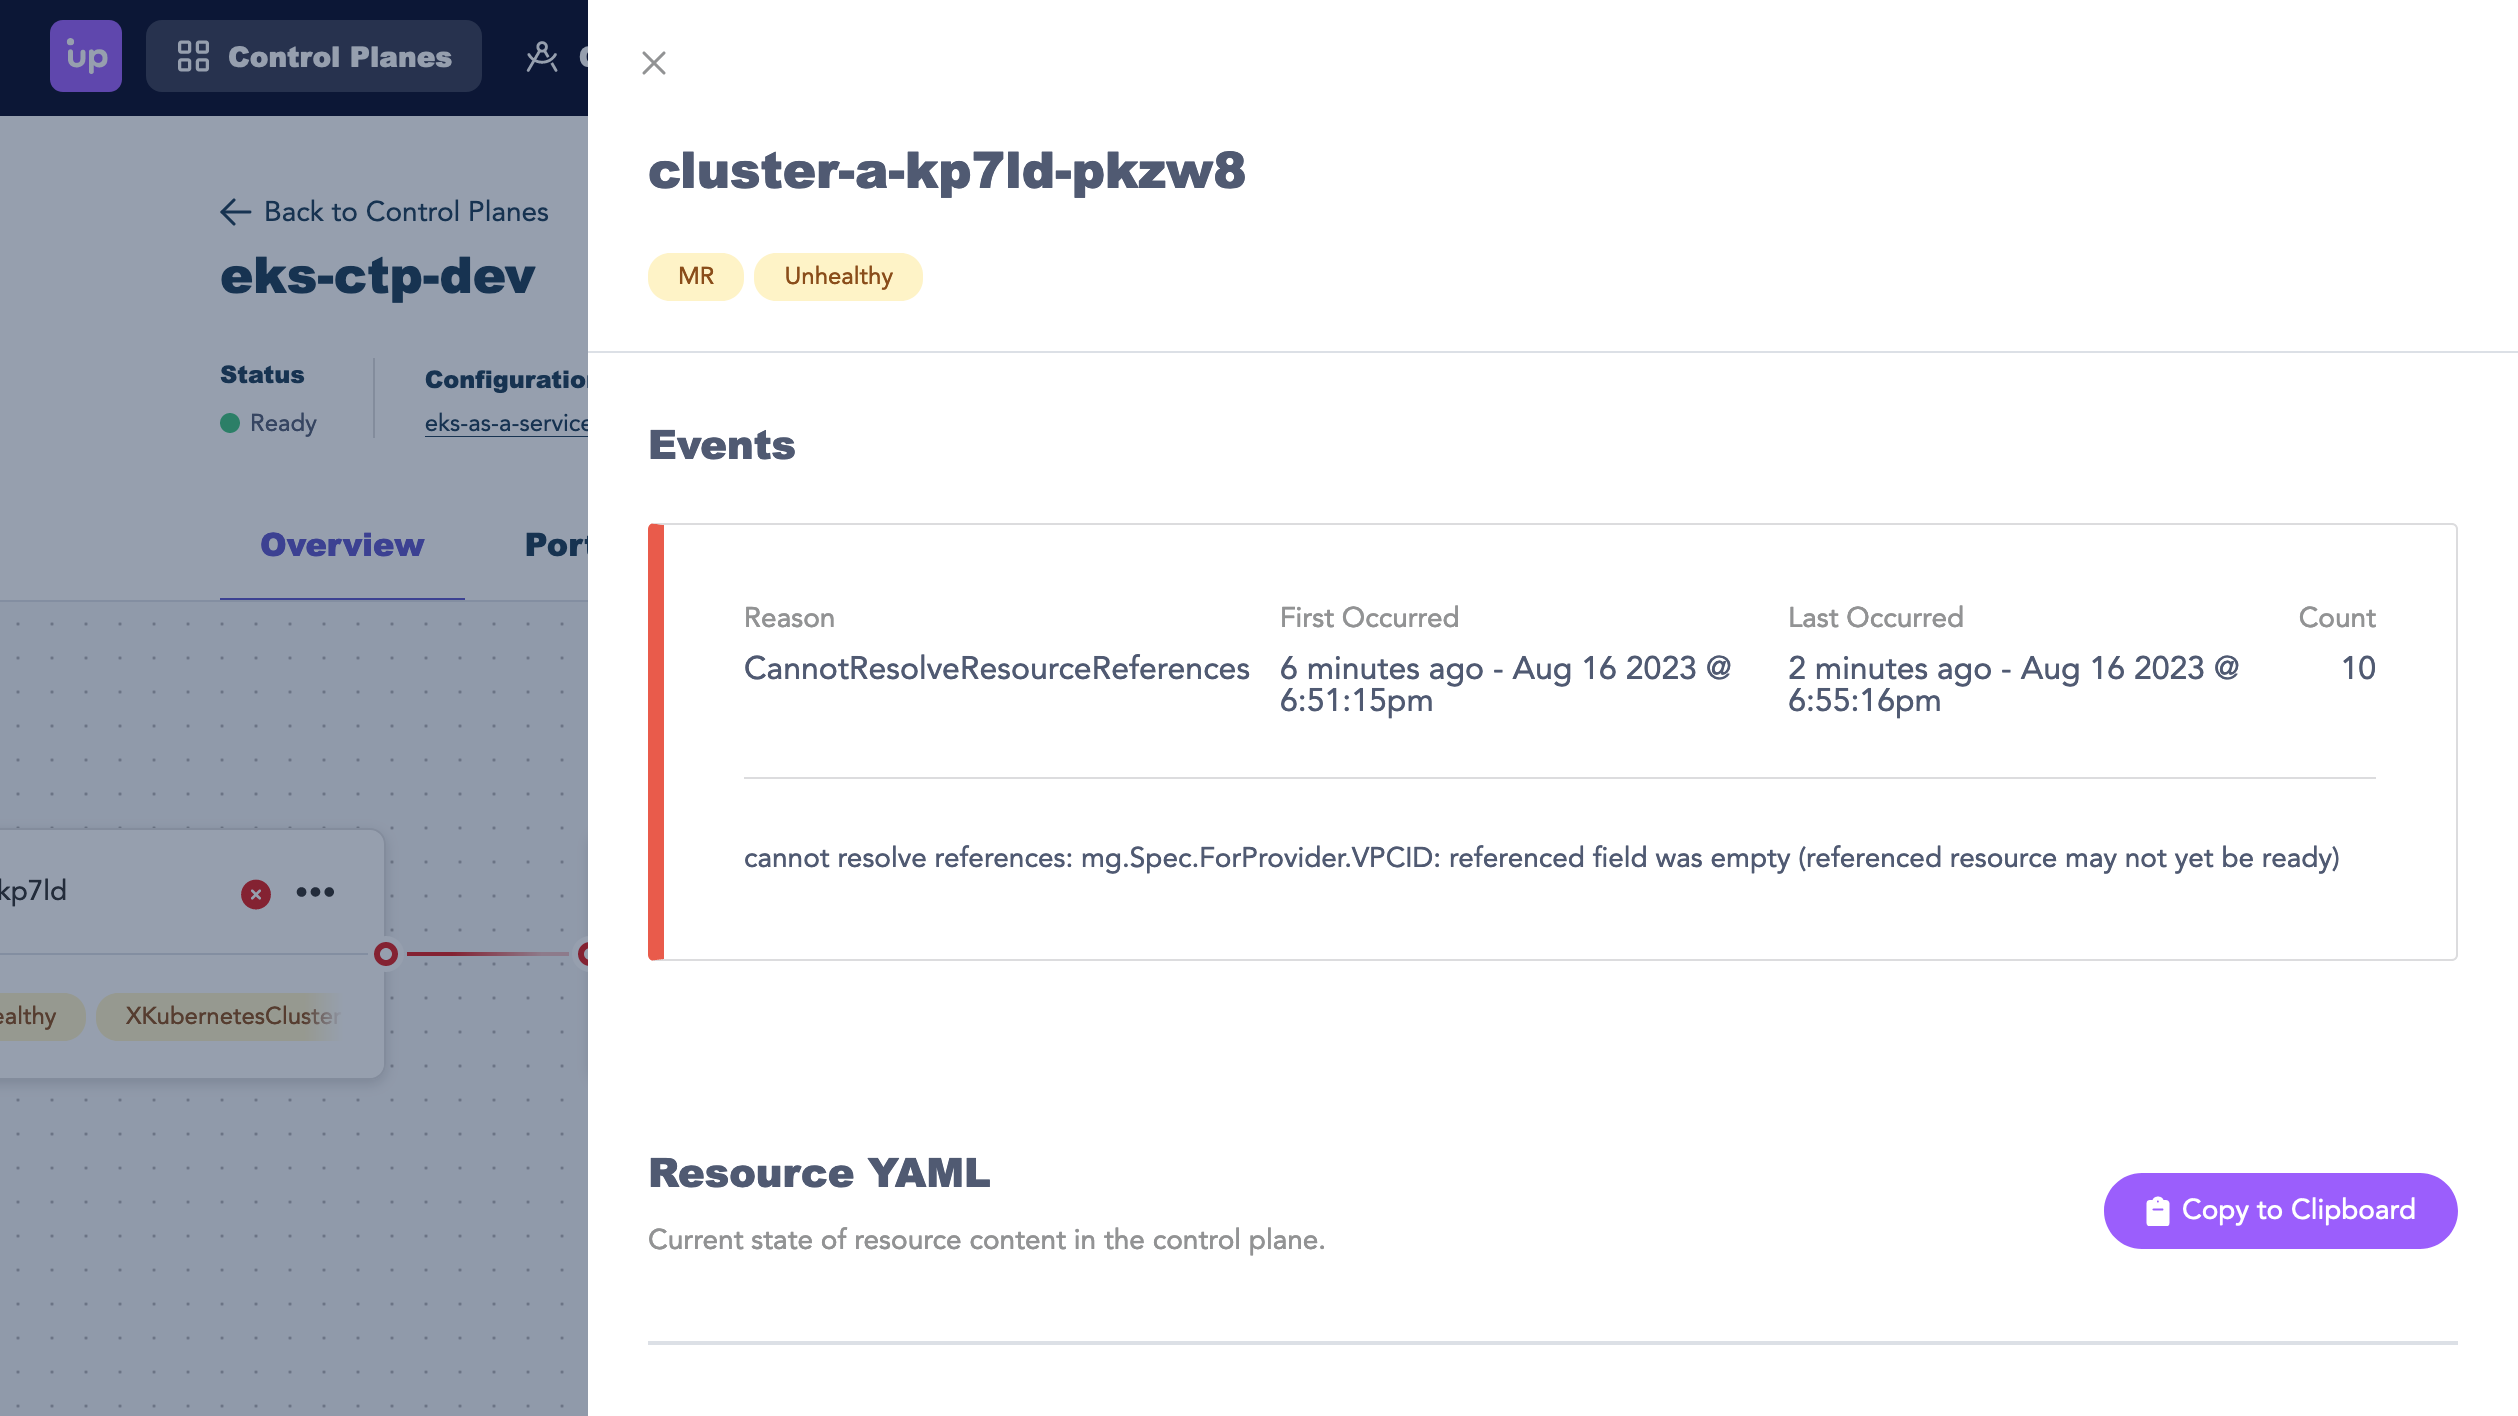
At the top of the graph I see an InternetGateway resource. I can see more details about the resource by clicking on the three dots in the upper right corner
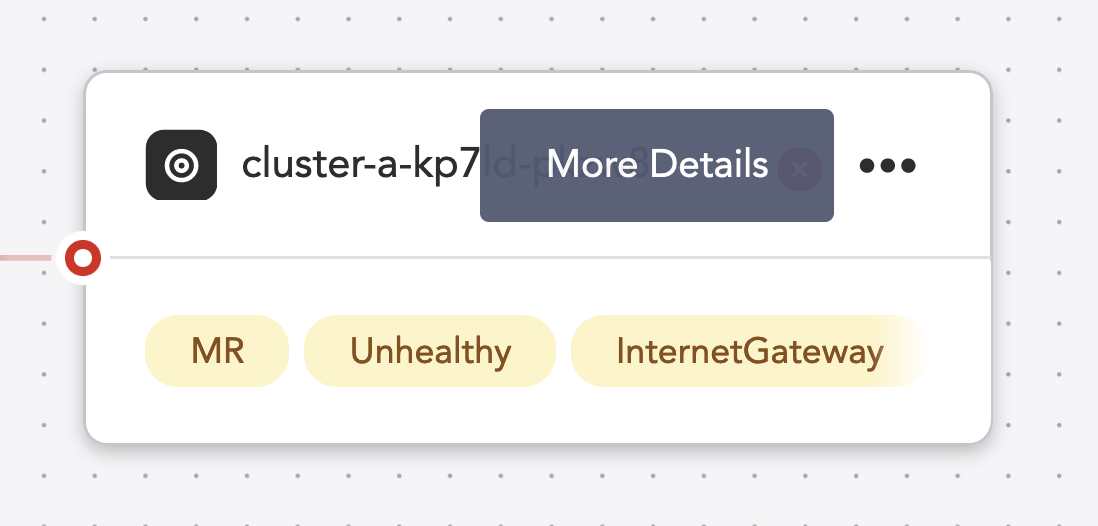
I can now see a detailed overview showing events emitted by the resource as well as status conditions. Its event stream indicates that it is waiting on the creation of another referenced resource, in this case a VPC:
Uncover the root issue
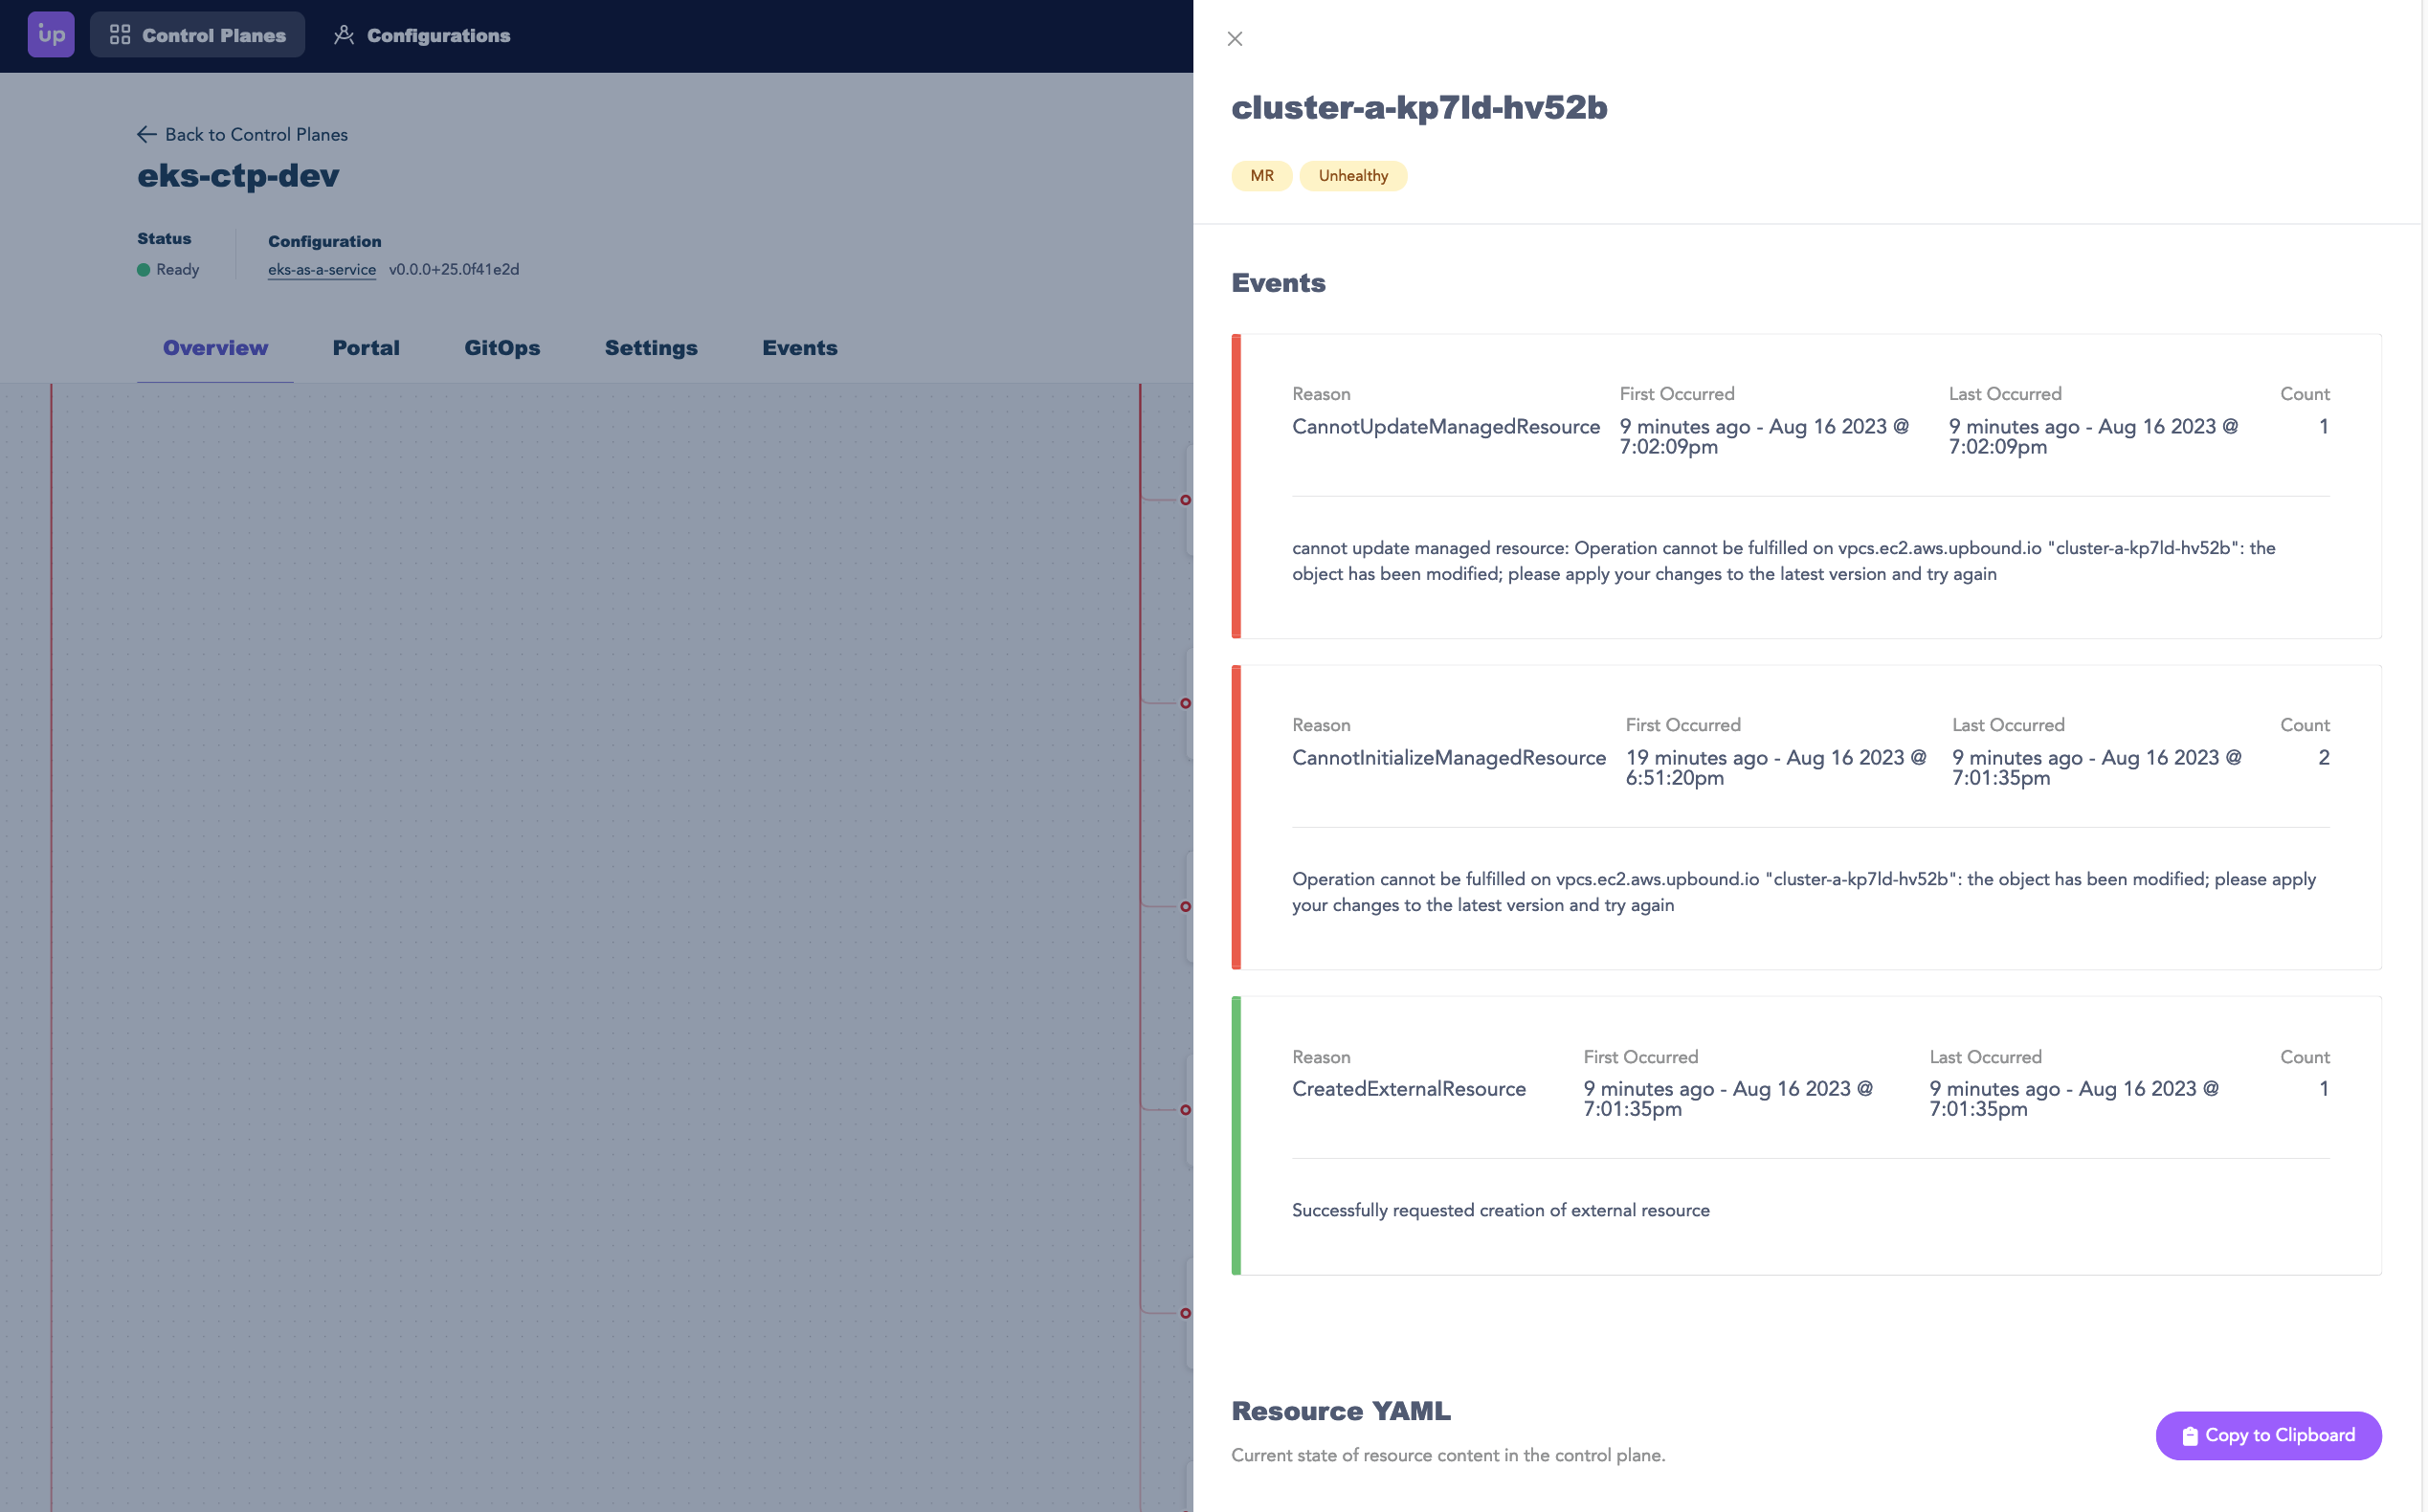
I’ll take a look at the details for the VPC resource next. At first glance, the events don’t indicate a clear issue.
By scrolling down to see status conditions within the resource YAML, I can see the following:
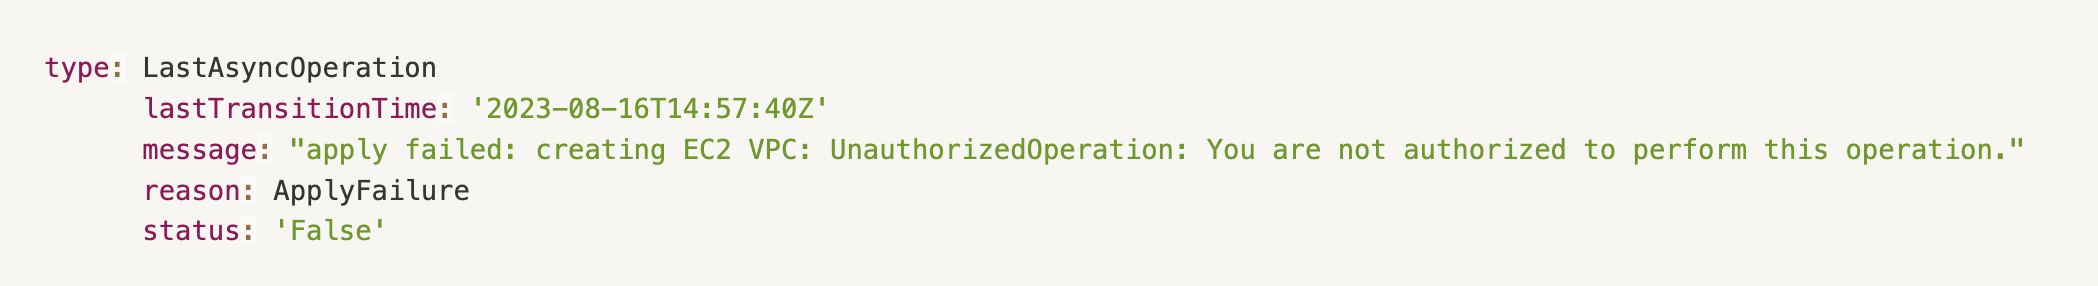
I used OIDC to create a trust relationship between AWS and my control plane. The above message indicates that when I set up my providerconfig to authorize my control plane with AWS, I may not have applied the right set of permissions to the role I assumed, meaning I am not able provision the full set of resources needed for my composition.
Attempt a resolution
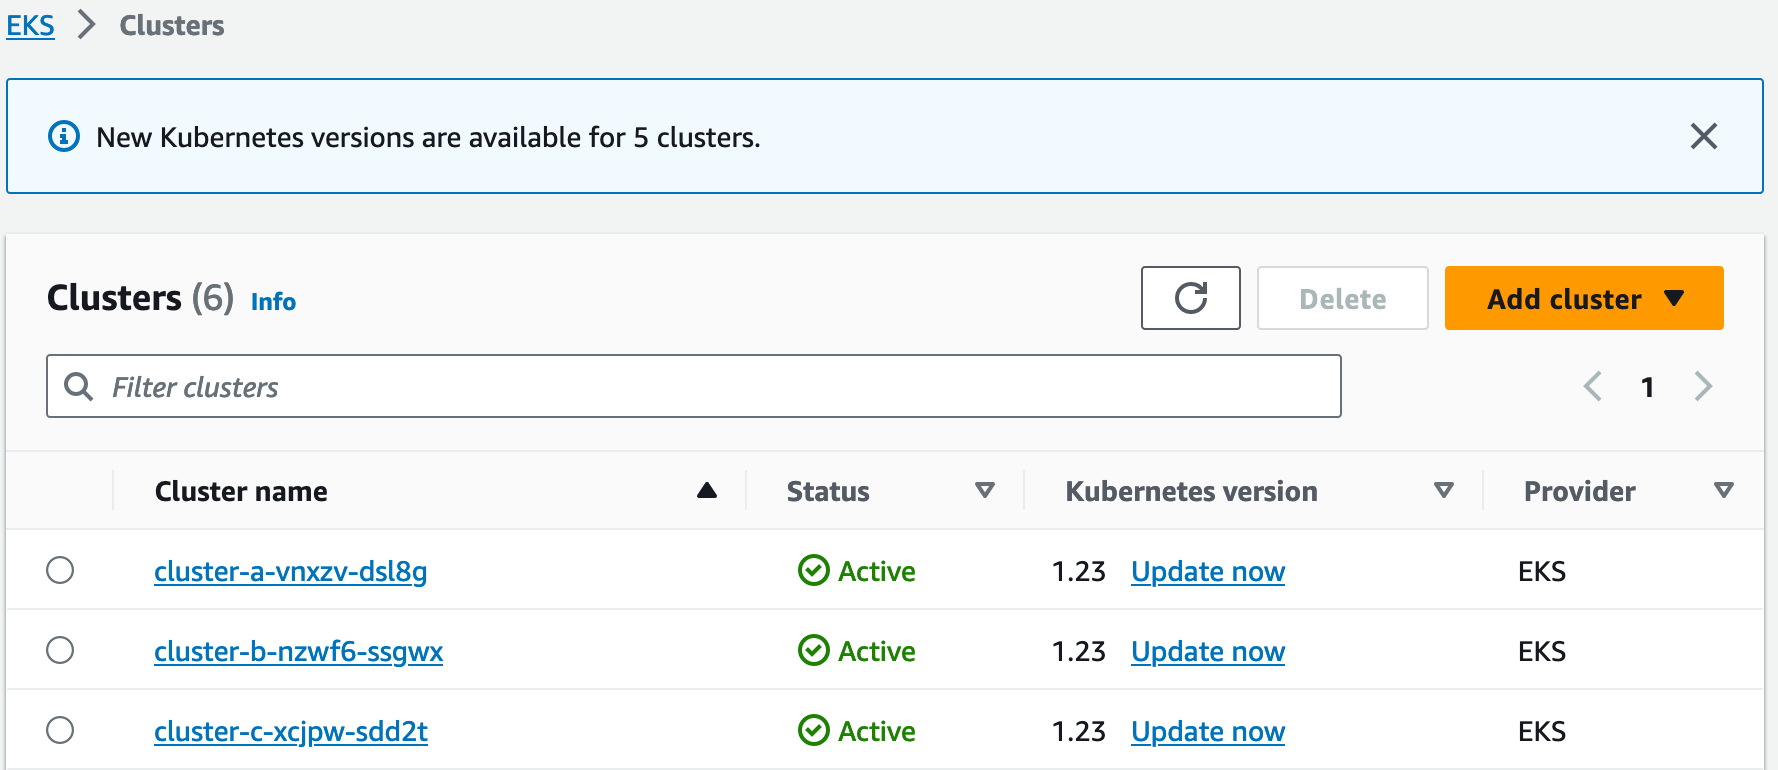
After heading to the AWS console to modify the permissions, I can shortly see that resources are beginning to be created successfully.
After a few minutes of waiting, the graph shows me that all of the resources have successfully been created. I now appear to have three healthy claims.
For the sake of this example, I’ll verify on the AWS side that everything has indeed been provisioned as expected.
Additional tools for debugging control planes
Although not needed for the above example, another tool at your disposal within the control plane explorer is the Events tab. This tab surfaces the events being emitted by your control planes, providers, and configurations in a single filterable list.
What’s next?
While we highlighted the experience of troubleshooting a single control plane, operating a production fleet at large scale presents a different set of challenges. To see solutions that can be built with Crossplane/Upbound which enable teams to control and simplify the deployment process for developers Register for “Two of the Biggest Promises of the Cloud Can Now Be Realized!” on August 30 at 8am PT now to learn more about these solutions, like Cluster-as-a-Service, Network-as-a-Service, and Database-as-a-Service, to save time and simplify your cloud-native experiences!